Categories
about:memory Firefox Memory allocation Memory consumption MemShrink Performance

Better documentation for memory profiling and leak detection tools

Until recently, the documentation for all of Mozilla’s memory profiling and leak detection tools had some major problems.

  • It was scattered across MDN, the Mozilla Wiki, and the Mozilla archive site (yes, really).
  • Documentation for several tools was spread across multiple pages.
  • Documentation for some tools was meagre, non-existent, or overly verbose.
  • Some of the documentation was out of date, e.g. describing tools that no longer exist.

A little while back I fixed these problems.

  • The documentation for these tools is now all on MDN. If you look at the MDN Performance page in the “Memory profiling and leak detection tools” section, you’ll see a brief description of each tool that explains the circumstances in which it is useful, and a link to the relevant documentation.
  • The full list of documented tools includes: about:memory, DMD, areweslimyet.com, BloatView, Refcount tracing and balancing, GC and CC logs, Valgrind, LeakSanitizer, Apple tools, TraceMalloc, Leak Gauge, and LogAlloc.
  • As well as consolidating all the pages in one place, I also improved some of the pages (with the help of people like Andrew McCreight). In particular, about:memory now has reasonably detailed documentation, something it has lacked until now.

Please take a look, and if you see any problems let me know. Or, if you’re feeling confident just fix things yourself! Thanks.

Categories
Data structures Firefox Memory consumption

mfbt/SegmentedVector.h

I just landed a new container type called mozilla::SegmentedVector in MFBT. It’s similar to nsTArray and mozilla::Vector, but the the element storage is broken into segments rather than being contiguous. This makes it less flexible than those types — currently you can only append elements and iterate over all elements.

Hoever, in cases where those operations suffice, you should strongly consider using it. It uses multiple moderate-sized storage chunks instead of a single large storage chunk, which greatly reduces the likelihood of OOM crashes, especially on Win32 where large chunks of address space can be difficult to find. (See bug 1096624 for a good example; use of a large nsTArray was triggering ~1% of all OOM crashes.) It also avoids the need for repeatedly allocating new buffers and copying existing data into them as it grows.

The declaration is as follows.

template<typename T,
         size_t IdealSegmentSize,
         typename AllocPolicy = MallocAllocPolicy>
class SegmentedVector
  • T is the element type.
  • IdealSegmentSize is the size of each segment, in bytes. It should be a power-of-two (to avoid slop), not too small (so you can fit a reasonable number of elements in each chunk, which keeps the per-segmente book-keeping overhead low) and not too big (so virtual OOM crashes are unlikely). A value like 4,096 or 8,192 or 16,384 is likely to be good.
  • AllocPolicy is the allocation policy. A SegmentedVector can be made infallible by using InfallibleAllocPolicy from mozalloc.h.

If you want to use SegmentedVector but it doesn’t support the operations you need, please talk to me. While it will never be as flexible as a contiguous vector type, there’s definitely scope for adding new operations.

Categories
DMD Firefox Memory allocation Memory consumption MemShrink

Please grow your buffers exponentially

If you record every heap allocation and re-allocation done by Firefox you find some interesting things. In particular, you find some sub-optimal buffer growth strategies that cause a lot of heap churn.

Think about a data structure that involves a contiguous, growable buffer, such as a string or a vector. If you append to it and it doesn’t have enough space for the appended elements, you need to allocate a new buffer, copy the old contents to the new buffer, and then free the old buffer. realloc() is usually used for this, because it does these three steps for you.

The crucial question: when you have to grow a buffer, how much do you grow it? One obvious answer is “just enough for the new elements”. That might seem  space-efficient at first glance, but if you have to repeatedly grow the buffer it can quickly turn bad.

Consider a simple but not outrageous example. Imagine you have a buffer that starts out 1 byte long and you add single bytes to it until it is 1 MiB long. If you use the “just-enough” strategy you’ll cumulatively allocate this much memory:

1 + 2 + 3 + … + 1,048,575 + 1,048,576 = 549,756,338,176 bytes

Ouch. O(n2) behaviour really hurts when n gets big enough. Of course the peak memory usage won’t be nearly this high, but all those reallocations and copying will be slow.

In practice it won’t be this bad because heap allocators round up requests, e.g. if you ask for 123 bytes you’ll likely get something larger like 128 bytes. The allocator used by Firefox (an old, extensively-modified version of jemalloc) rounds up all requests between 4 KiB and 1 MiB to the nearest multiple of 4 KiB. So you’ll actually allocate approximately this much memory:

4,096 + 8,192 + 12,288 + … + 1,044,480 + 1,048,576 = 134,742,016 bytes

(This ignores the sub-4 KiB allocations, which in total are negligible.) Much better. And if you’re lucky the OS’s virtual memory system will do some magic with page tables to make the copying cheap. But still, it’s a lot of churn.

A strategy that is usually better is exponential growth. Doubling the buffer each time is the simplest strategy:

4,096 + 8,192 + 16,384 + 32,768 + 65,536 + 131,072 + 262,144 + 524,288 + 1,048,576 = 2,093,056 bytes

That’s more like it; the cumulative size is just under twice the final size, and the series is short enough now to write it out in full, which is nice — calls to malloc() and realloc() aren’t that cheap because they typically require acquiring a lock. I particularly like the doubling strategy because it’s simple and it also avoids wasting usable space due to slop.

Recently I’ve converted “just enough” growth strategies to exponential growth strategies in XDRBuffer and nsTArray, and I also found a case in SQLite that Richard Hipp has fixed. These pieces of code now match numerous places that already used exponential growth: pldhash, JS::HashTable, mozilla::Vector, JSString, nsString, and pdf.js.

Pleasingly, the nsTArray conversion had a clear positive effect. Not only did the exponential growth strategy reduce the amount of heap churn and the number of realloc() calls, it also reduced heap fragmentation: the “heap-overhead” part of the purple measurement on AWSY (a.k.a. “RSS: After TP5, tabs closed [+30s, forced GC]”) dropped by 4.3 MiB! This makes sense if you think about it: an allocator can fulfil power-of-two requests like 64 KiB, 128 KiB, and 256 KiB with less waste than it can awkward requests like 244 KiB, 248 KiB, 252 KiB, etc.

So, if you know of some more code in Firefox that uses a non-exponential growth strategy for a buffer, please fix it, or let me know so I can look at it. Thank you.

Categories
Firefox Memory consumption MemShrink

The story of a tricky bug

The Bug Report

A few weeks ago I skimmed through /r/firefox and saw a post by a user named DeeDee_Z complaining about high memory usage in Firefox. Somebody helpfully suggested that DeeDee_Z look at about:memory, which revealed thousands of blank windows like this:

  │    │  ├────0.15 MB (00.01%) ++ top(about:blank, id=1001)
  │    │  ├────0.15 MB (00.01%) ++ top(about:blank, id=1003)
  │    │  ├────0.15 MB (00.01%) ++ top(about:blank, id=1005

I filed bug 1041808 and asked DeeDee_Z to sign up to Bugzilla so s/he could join the discussion. What followed was several weeks of back and forth, involving suggestions from no fewer than seven Mozilla employees. DeeDee_Z patiently tried numerous diagnostic steps, such as running in safe mode, pasting info from about:support, getting GC/CC logs, and doing a malware scan. (Though s/he did draw the line at running wireshark to detect if any unusual network activity was happening, which I think is fair enough!)

But still there was no progress. Nobody else was able to reproduce the problem, and even DeeDee_Z had trouble making it happen reliably.

And then on August 12, more than three weeks after the bug report was filed, Peter Van der Beken commented that he had seen similar behaviour on his machine, and by adding some logging to Firefox’s guts he had a strong suspicion that it was related to having the “keep until” setting for cookies set to “ask me every time”. DeeDee_Z had the same setting, and quickly confirmed that changing it fixed the problem. Hooray!

I don’t know how Peter found the bug report — maybe he went to file a new bug report about this problem and Bugzilla’s duplicate detection identified the existing bug report — but it’s great that he did. Two days later he landed a simple patch to fix the problem. In Peter’s words:

The patch makes the dialog for allowing/denying cookies actually show up when a cookie is set through the DOM API. Without the patch the dialog is created, but never shown and so it sticks around forever.

This fix is on track to ship in Firefox 34, which is due to be released in late November.

Takeaway lessons

There are a number of takeaway lessons from this story.

First, a determined bug reporter is enormously helpful. I often see vague complaints about Firefox on websites (or even in Bugzilla) with no responses to follow-up questions. In contrast, DeeDee_Z’s initial complaint was reasonably detailed. More importantly, s/he did all the follow-up steps that people asked her/him to do, both on Reddit and in Bugzilla. The about:memory data made it clear it was some kind of window leak, and although the follow-up diagnostic steps didn’t lead to the fix in this case, they did help rule out a number of possibilities. Also, DeeDee_Z was extremely quick to confirm that Peter’s suggestion about the cookie setting fixed the problem, which was very helpful.

Second, many (most?) problems don’t affect everyone. This was quite a nasty problem, but the “ask me every time” setting is not commonly used because causes lots of dialogs to pop up, which few users have the patience to deal with. It’s very common that people have a problem with Firefox (or any other piece of software), incorrectly assume that it affects everyone else equally, and conclude with “I can’t believe anybody uses this thing”. I call this “your experience is not universal“. This is particular true for web browsers, which unfortunately are enormously complicated and have many combinations of settings get little or no testing.

Third, and relatedly, it’s difficult to fix problems that you can’t reproduce. It’s only because Peter could reproduce the problem that he was able to do the logging that led him to the solution.

Fourth, it’s important to file bug reports in Bugzilla. Bugzilla is effectively the Mozilla project’s memory, and it’s monitored by many contributors. The visibility of a bug report in Bugzilla is vastly higher than a random complaint on some other website. If the bug report hadn’t been in Bugzilla, Peter wouldn’t have stumbled across it. So even if he had fixed it, DeeDee_Z wouldn’t have known and probably would have had been stuck with the problem until Firefox 34 came out. That’s assuming s/he didn’t switch to a different browser in the meantime.

Fifth, Mozilla does care about memory usage, particularly cases where memory usage balloons unreasonably. We’ve had a project called MemShrink running for more than three years now. We’ve fixed hundreds of problems, big and small, and continue to do so. Please use about:memory to start the diagnosis, and add the “[MemShrink]” tag to any bug reports in Bugzilla that relate to memory usage, and we will triage them in our fortnightly MemShrink meetings.

Finally, luck plays a part. I don’t often look at /r/firefox, and I could have easily missed DeeDee_Z’s complaint. Also, it was lucky that Peter found the bug in Bugzilla. Many tricky bugs don’t get resolved this quickly.

Categories
about:memory DMD Firefox Memory consumption MemShrink

Measuring memory used by third-party code

Firefox’s memory reporting infrastructure, which underlies about:memory, is great. And when it lacks coverage — causing the “heap-unclassified” number to get large — we can use DMD to identify where the unreported allocations are coming from. Using this information, we can extend existing memory reporters or write new ones to cover the missing heap blocks.

But there is one exception: third-party code. Well… some libraries support custom allocators, which is great, because it lets us provide a counting allocator. And if we have a copy of the third-party code within Firefox, we can even use some pre-processor hacks to forcibly provide custom counting allocators for code that doesn’t support them.

But some heap allocations are done by code we have no control over, like OpenGL drivers. For example, after opening a simple WebGL demo on my Linux box, I have over 50% “heap-unclassified”.

208.11 MB (100.0%) -- explicit
├──107.76 MB (51.78%) ── heap-unclassified

DMD’s output makes it clear that the OpenGL drivers are responsible. The following record is indicative.

Unreported: 1 block in stack trace record 2 of 3,597
 15,486,976 bytes (15,482,896 requested / 4,080 slop)
 6.92% of the heap (20.75% cumulative); 10.56% of unreported (31.67% cumulative)
 Allocated at
 replace_malloc (/home/njn/moz/mi8/co64dmd/memory/replace/dmd/../../../../memory/replace/dmd/DMD.cpp:1245) 0x7bf895f1
 _swrast_CreateContext (??:?) 0x3c907f03
 ??? (/usr/lib/x86_64-linux-gnu/dri/i965_dri.so) 0x3cd84fa8
 ??? (/usr/lib/x86_64-linux-gnu/dri/i965_dri.so) 0x3cd9fa2c
 ??? (/usr/lib/x86_64-linux-gnu/dri/i965_dri.so) 0x3cd8b996
 ??? (/usr/lib/x86_64-linux-gnu/dri/i965_dri.so) 0x3ce1f790
 ??? (/usr/lib/x86_64-linux-gnu/dri/i965_dri.so) 0x3ce1f935
 glXGetDriverConfig (??:?) 0x3dce1827
 glXDestroyGLXPixmap (??:?) 0x3dcbc213
 glXCreateNewContext (??:?) 0x3dcbc48a
 mozilla::gl::GLContextGLX::CreateGLContext(mozilla::gfx::SurfaceCaps const&, mozilla::gl::GLContextGLX*, bool, _XDisplay*, unsigned long, __GLXFBConfigRec*, bool, gfxXlibSurface*) (/home/njn/moz/mi8/co64dmd/gfx/gl/../../../gfx/gl/GLContextProviderGLX.cpp:783) 0x753c99f4

The bottom-most frame is for a function (CreateGLContext) within Firefox’s codebase, and then control passes to the OpenGL driver, which eventually does a heap allocation, which ends up in DMD’s replace_malloc function.

The following DMD report is a similar case that shows up on Firefox OS.

Unreported: 1 block in stack trace record 1 of 463
 1,454,080 bytes (1,454,080 requested / 0 slop)
 9.75% of the heap (9.75% cumulative); 21.20% of unreported (21.20% cumulative)
 Allocated at
 replace_calloc /Volumes/firefoxos/B2G/gecko/memory/replace/dmd/DMD.cpp:1264 (0xb6f90744 libdmd.so+0x5744)
 os_calloc (0xb25aba16 libgsl.so+0xda16) (no addr2line)
 rb_alloc_primitive_lists (0xb1646ebc libGLESv2_adreno.so+0x74ebc) (no addr2line)
 rb_context_create (0xb16446c6 libGLESv2_adreno.so+0x726c6) (no addr2line)
 gl2_context_create (0xb16216f6 libGLESv2_adreno.so+0x4f6f6) (no addr2line)
 eglCreateClientApiContext (0xb25d3048 libEGL_adreno.so+0x1a048) (no addr2line)
 qeglDrvAPI_eglCreateContext (0xb25c931c libEGL_adreno.so+0x1031c) (no addr2line)
 eglCreateContext (0xb25bfb58 libEGL_adreno.so+0x6b58) (no addr2line)
 eglCreateContext /Volumes/firefoxos/B2G/frameworks/native/opengl/libs/EGL/eglApi.cpp:527 (0xb423dda2 libEGL.so+0xeda2)
 mozilla::gl::GLLibraryEGL::fCreateContext(void*, void*, void*, int const*) /Volumes/firefoxos/B2G/gecko/gfx/gl/GLLibraryEGL.h:180 (discriminator 3) (0xb4e88f4c libxul.so+0x789f4c)

We can’t traverse these allocations in the usual manner to measure them, because we have no idea about the layout of the relevant data structures. And we can’t provide a custom counting allocator to code outside of Firefox’s codebase.

However, although we pass control to the driver, control eventually comes back to the heap allocator, and that is something that we do have some power to change. So I had an idea to toggle some kind of mode that records all the allocations that occur within a section of code, as the following code snippet demonstrates.

SetHeapBlockTagForThread("webgl-create-new-context");
context = glx.xCreateNewContext(display, cfg, LOCAL_GLX_RGBA_TYPE, glxContext, True);
ClearHeapBlockTagForThread();

The calls on either side of glx.xCreateNewContext tell the allocator that it should tag all allocations done within that call. And later on, the relevant memory reporter can ask the allocator how many of these allocations remain and how big they are. I’ve implemented a draft version of this, and it basically works, as the following about:memory output shows.

216.97 MB (100.0%) -- explicit
├───78.50 MB (36.18%) ── webgl-contexts
├───32.37 MB (14.92%) ── heap-unclassified

The implementation is fairly simple.

  • There’s a global hash table which records which live heap blocks have a tag associated with them. (Most heap blocks don’t have a tag, so this table stays small.)
  • When SetHeapBlockTagForThread is called, the given tag is stored in thread-local storage. When ClearHeapBlockTagForThread is called, the tag is cleared.
  • When an allocation happens, we (quickly) check if there’s a tag set for the current thread and if so, put a (pointer,tag) pair into the table. Otherwise, we do nothing extra.
  • When a deallocation happens, we check if the deallocated block is in the table, and remove it if so.
  • To find all the live heap blocks with a particular tag, we simply iterate over the table looking for tag matches. This can be used by a memory reporter.

Unfortunately, the implementation isn’t suitable for landing in Firefox’s code, for several reasons.

  • It uses Mike Hommey’s replace_malloc infrastructure to wrap the default allocator (jemalloc). This works well — DMD does the same thing — but using it requires doing a special build and then setting some environment variables at start-up. This is ok for an occasional-use tool that’s only used by Firefox developers, but it’s important that about:memory works in vanilla builds without any additional effort.
  • Alternatively, I could modify jemalloc directly, but we’re hoping to one day move away from our old, heavily-modified version of jemalloc and start using an unmodified jemalloc3.
  • It may have a non-trivial performance hit. Although I haven’t measured performance yet — the above points are a bigger show-stopper at the moment — I’m worried about having to do a hash table lookup on every deallocation. Alternative implementations (store a marker in each block, or store tagged blocks in their own zone) are possible but present their own difficulties.
  • It can miss some allocations. When adding a tag for a particular section of code, you don’t want to mark every allocation that occurs while that section executes, because there could be multiple threads running and you don’t want to mark allocations from other threads. So it restricts the marking to a single thread, but if the section creates a new thread itself, any allocations done on that new thread will be missed. This might sound unlikely, but my implementation appears to miss some allocations and this is my best theory as to why.

This issue of OpenGL drivers and other kinds of third-party code has been a long-term shortcoming with about:memory. For the first time I have a partial solution, though it still has major problems. I’d love to hear if anyone has additional ideas on how to make it better.

Categories
B2G Fennec Firefox Garbage Collection Memory consumption MemShrink pdf.js

MemShrink’s 3rd birthday

June 14, 2014 was the third anniversary of the first MemShrink meeting. MemShrink is a mature effort at this point, and many of the problems that motivated its creation have been fixed. Nonetheless, there are still some areas for improvement. So, as I did at this time last year, I’ll take the opportunity to update the “big ticket items” list.

The Old Big Ticket Items List
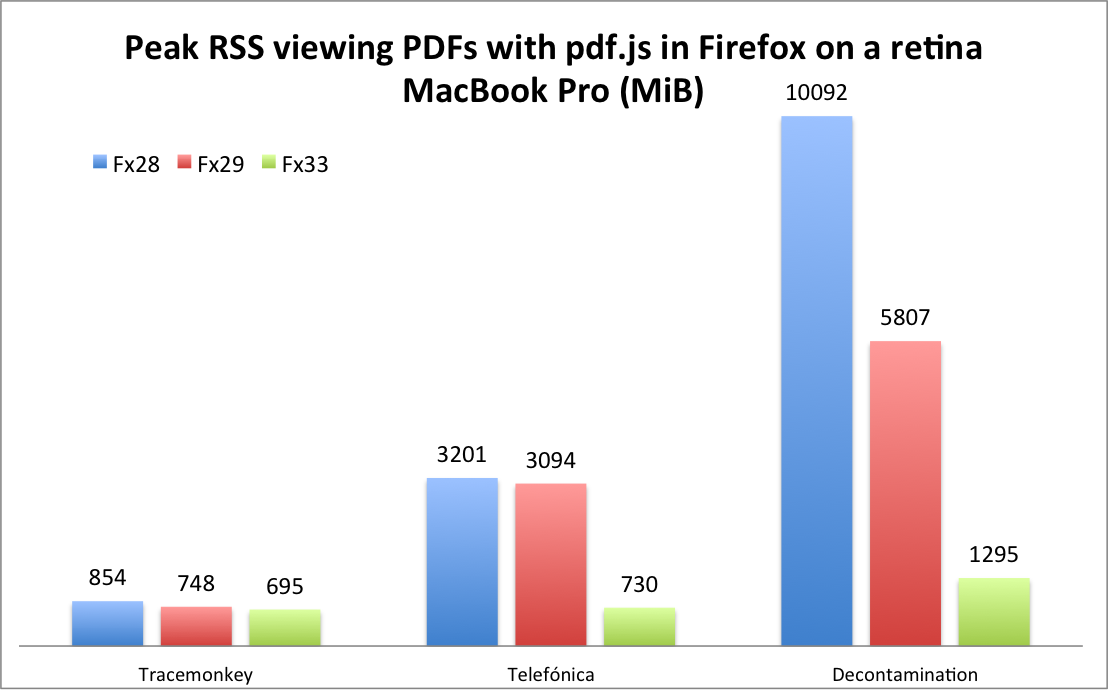
#5: pdf.js

pdf.js is the PDF viewer that now ships by default in Firefox. I greatly reduced its memory usage in two rounds, first in February, and again in June. The first round of improvements were released in Firefox 29, and the second round is due to be released in Firefox 33, which should be out in mid-October.

pdf.js will still use more memory than native PDF viewers, but the situation has improved enough that it can be removed from this list.

#4: Dev tools

See below.

#3: B2G Nuwa

Cervantes Yu, Thinker Li, and others succeeded in landing Nuwa, an impressive technical achievement that increased the amount of memory sharing between different processes on Firefox OS. This allows many more apps to run at once. I think this is present in Firefox OS 1.3 and later.

#2: Compacting Generational GC

See below.

#1: Better Foreground Tab Image Handling

Timothy Nikkel completely fixed the massive spikes in decoded image data that we used to get on image-heavy pages. This was a fantastic improvement that shipped in Firefox 26.

The New Big Ticket Items List

In a break from tradition, I will present the items in alphabetical order, rather than ranking them. This reflects the fact that I don’t have a clear opinion on the relevant importance of these different items. (I view this as a good thing, because it means that I feel there aren’t any hair-on-fire problems.)

Better regression detection

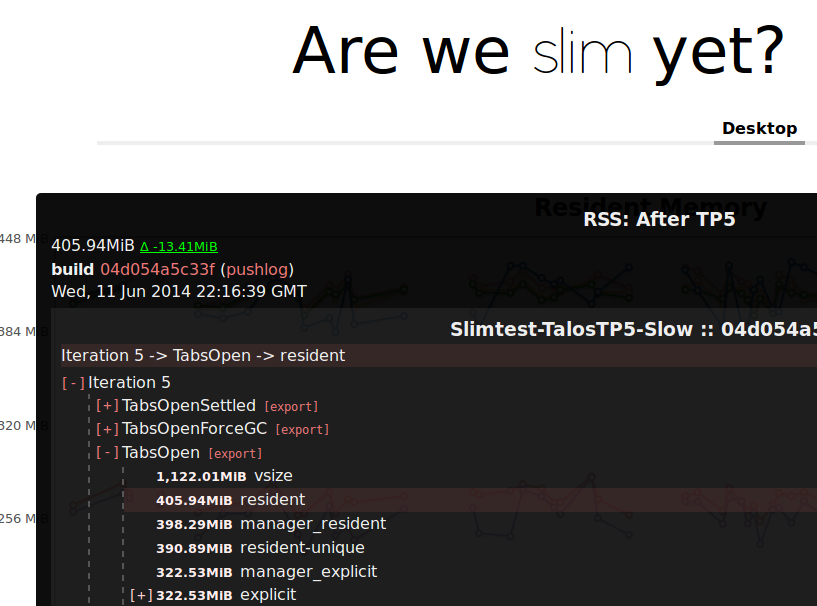
areweslimyet.com (a.k.a. AWSY) is our best tool for detecting memory usage regressions. It currently tracks Firefox and Firefox for Android, and there are plans to integrate Firefox OS.

Unfortunately, although AWSY has been successful at detecting large regressions, leading to them being fixed, its measurements are noisy enough that detecting smaller regressions is difficult. As a result, the general trend of the graphs has been upward. I do not think this is as bad as it looks at first glance, because Firefox’s behaviour in the worst cases — which matter more than the average case — is much better than it used to be. Nonetheless, improved sensitivity here would be an excellent thing, and Eric Rahm is actively working on this.

Developer tools

Developer-oriented memory profiling tools are under active development by Nick Fitzgerald, Jim Blandy, and others. A lot of the necessary profiling infrastructure is in place, and this seems to be progressing well, though I don’t know when it’s expected to be finished.

By the way, if you haven’t tried Firefox’s dev tools recently, you should! They have improved an incredible amount in the past year or so.

GC Arena Fragmentation

Generational GC landed a few months ago. I had been hoping that this would help reduce GC fragmentation, but the effect was small. It looks like compacting GC is what’s needed to make a big difference here, though some smaller tweaks may help things a little.

Tarako

Tarako is the codename for the “$25 phone” running Firefox OS that will ship in India and other countries later this year. It has a paltry 128 MiB of RAM, so memory usage is critical. Since the hardware first became available to Mozilla employees at the start of the year, Tarako has improved from “almost unusable” to “not bad”. But apps still close due to OOMs fairly frequently, especially when a user does something that involves two apps working together in some way.

There is no single change that will decisively fix this problem for Tarako;  further improvements will require an ongoing grind of work from many engineers. Improvements made for Tarako are also likely to benefit higher-end Firefox OS devices as well.

Windows OOM crashes

The number of out-of-memory (OOM) crashes that occur on Windows is relatively high. A sizeable fraction of these appear to be 32-bit virtual OOM crashes, caused by running out of address space.

Things that will mitigate this include modifications to jemalloc and the JS allocator, as well as Electrolysis. And some additional data and analysis may help us understand the problem better.

The ultimate solution, for users on 64-bit versions of Windows, is 64-bit Firefox builds for Windows, though it’ll be a while before those builds are in good enough shape to ship to regular users.

Summary

Three items from the old list (pdf.js, Nuwa, image handling) have been ticked off.  Two items remain (devtools, GC fragmentation), the latter in altered form, and both are a lot closer to completion than they were. Three new items (regression detection, Tarako, and Windows OOMs) have been added.

Let me know if I’ve omitted anything important!

Categories
Memory consumption MemShrink pdf.js

An even slimmer pdf.js

TL;DR: Firefox’s built-in PDF viewer is on track to benefit from additional large reductions in memory consumption when Firefox 33 is released in mid-October.

Earlier this year I made some major improvements to the memory usage and speed of pdf.js, Firefox’s built-in PDF viewer. At the time I was quite pleased with myself. I had picked all the low-hanging fruit and reached a point of diminishing returns.

Some unexpected measurements

Shortly after that, while on a plane I tried pdf.js on my Mac laptop. I was horrified to find that memory usage was much higher than on the Linux desktop machine on which I had done my optimizations. The first document I measured made Firefox’s RSS (resident set size, a.k.a. physical memory usage) peak at over 1,000 MiB. The corresponding number on my Linux desktop had been 400 MiB! What was going on?

The short answer is “canvases”. pdf.js uses HTML canvas elements to render each PDF page. These can be millions of pixels in size, and each canvas pixel takes 32-bits of RGBA data. But on Linux this data is not stored within the Firefox process. Instead, it gets passed to the X server. Firefox’s about:memory page does report the canvas usage under the “canvas-2d-pixels” and “gfx-surface-xlib” labels, but I hadn’t seen those — during my optimization work I had only measured the RSS of the Firefox process. RSS is usually the best single number to focus on, but in this case it was highly misleading.

In contrast, on Mac the canvas data is stored within the process, which is why Firefox’s RSS is so much higher on Mac. (There’s also the fact that my MacBook has a retina screen, which means the canvases used have approximately four times as many pixels as the canvases used on my Linux machine.)

Fixing the problem

It turns out that pdf.js was intentionally caching an overly generous number of canvases (20) and then unintentionally failing to dispose of them in a timely manner. This could result in hundreds of canvases being held onto unnecessarily if you scrolled quickly through a large document. On my MacBook each canvas is over 20 MiB, so the resultant memory spike could be enormous.

Happily, I was able to fix this behaviour with four tiny patches. pdf.js now caches only 10 canvases, and disposes of any excess ones immediately.

Measurements

I measured the effects of both rounds of optimization on the following three documents on my Mac.

  • TraceMonkey: This is an academic paper about the TraceMonkey JIT compiler. It’s a 14 page Latex document containing several pictures and graphs.
  • Telefónica: This is the 2009 annual report from Telefónica. It’s a 122 page full-colour document with many graphs, tables and pictures.
  • Decontamination: This is an old report about the decontamination of an industrial site in New Jersey. It’s a 226 page scan of a paper document that mostly consists of black and white typewritten text and crude graphs, with only few pages featuring colour.

For each document, I measure the peak RSS while scrolling quickly from the first page to the last by holding down the “fn” and down keys at the same time.  Although this is a stress test, it’s not unrealistic; it’s easy to imagine people quickly scrolling through 10s or even 100s of pages of a PDF to find a particular page.

I did this three times for each document and picked the highest value. The results are shown by the following graph. The “Fx28” bars show the original peak RSS values; the “Fx29” bars show the peak RSS values after my first round of optimizations; and the “Fx33” bars show the peak RSS values after my second round of optimizations.

pdfjs

Comparing Firefox 28 and Firefox 33, the reductions in peak RSS for the three documents are 1.2x, 4.4x, and 7.8x. It makes sense that the relative improvements increase with the length of the documents.

Despite these major improvements, pdf.js still uses substantially more memory than native PDF viewers. So we need to keep chipping away… but it’s also worth recognizing how far we’ve come.

Status

These patches have landed in the master pdf.js repository. They have not yet imported into Firefox’s code, but this will happen at some point during the development cycle for Firefox 33. Firefox 33 is on track to be released in mid-October.

Categories
about:memory Memory consumption MemShrink

areweslimyet.com data is now exportable and diffable

areweslimyet.com (a.k.a. AWSY) tracks Firefox’s memory usage on a basic workload that opens lots of websites. It’s not a perfect tool — you shouldn’t consider its measurements as a reliable proxy for Firefox’s memory usage in general — but it does help detect regressions.

One thing it doesn’t support is doing diffs between separate runs. Until now, that is! Thanks to work done by Eric Rahm, it’s now possible to download the data for each snapshot done during a run. This file can then be loaded in about:memory. It’s also possible to download the data for two snapshots and diff them in about:memory. Yay! This diff workflow isn’t super slick, as it requires the downloading of two files and then the loading of them in about:memory. But it’s a lot better than manually eyeballing two sets of data in two separate AWSY tabs, which was the best we could do previously. Furthermore, AWSY and about:memory already duplicate some functionality, and this implementation avoids increasing the amount of duplication.

To do the export, select a single run (zooming in on the graph appropriately) and click on the red “[export]” link next to the appropriate snapshot, as seen in the following screenshot.

Screenshot of AWSY showing the export links

Once it has finished generating the data, the “[export]” link changes to “[download]”, and you can click on it again to do the download.

This is a first step towards improving AWSY so that it can detect memory usage regressions with much higher sensitivity than it currently has.

Categories
AdBlock Plus Firefox Memory consumption

AdBlock Plus’s effect on Firefox’s memory usage

[Update: Wladimir Palant has posted a response on the AdBlock Plus blog. Also, a Chrome developer using the handle “Klathmon” has posted numerous good comments in the Reddit discussion of this post, explaining why ad-blockers are inherently CPU- and memory-intensive, and why integrating ad-blocking into a browser wouldn’t necessarily help.]

AdBlock Plus (ABP) is the most popular add-on for Firefox. AMO says that it has almost 19 million users, which is almost triple the number of the second most popular add-on. I have happily used it myself for years — whenever I use a browser that doesn’t have an ad blocker installed I’m always horrified by the number of ads there are on the web.

But we recently learned that ABP can greatly increase the amount of memory used by Firefox.

First, there’s a constant overhead just from enabling ABP of something like 60–70 MiB. (This is on 64-bit builds; on 32-bit builds the number is probably a bit smaller.) This appears to be mostly due to additional JavaScript memory usage, though there’s also some due to extra layout memory.

Second, there’s an overhead of about 4 MiB per iframe, which is mostly due to ABP injecting a giant stylesheet into every iframe. Many pages have multiple iframes, so this can add up quickly. For example, if I load TechCrunch and roll over the social buttons on every story (thus triggering the loading of lots of extra JS code), without ABP, Firefox uses about 194 MiB of physical memory. With ABP, that number more than doubles, to 417 MiB. This is despite the fact that ABP prevents some page elements (ads!) from being loaded.

An even more extreme example is this page, which contains over 400 iframes. Without ABP, Firefox uses about 370 MiB. With ABP, that number jumps to 1960 MiB. Unsurprisingly, the page also loads more slowly with ABP enabled.

So, it’s clear that ABP greatly increases Firefox’s memory usage. Now, this isn’t all bad. Many people (including me!) will be happy with this trade-off — they will gladly use extra memory in order to block ads. But if you’re using a low-end machine without much memory, you might have different priorities.

I hope that the ABP authors can work with us to reduce this overhead, though I’m not aware of any clear ideas on how to do so. In the meantime, it’s worth keeping these measurements in mind. In particular, if you hear people complaining about Firefox’s memory usage, one of the first questions to ask is whether they have ABP installed.

[A note about the comments: I have deleted 17 argumentative, repetitive, borderline-spam comments from a single commenter — after giving him a warning via email — and I will delete any further comments from him on this post. As a result, I also had to delete three replies to his comments from others, for which I apologize.]

Categories
Firefox Garbage Collection Memory consumption MemShrink

Generational GC has landed

Big news: late last week, generational garbage collection landed. It was backed out at first due to some test failures, but then re-landed and appears to have stuck.

This helps with performance. There are certain workloads where generational GC makes the code run much faster, and Firefox hasn’t been able to keep up with Chrome on these. For example, it has made Firefox slightly faster on the Octane benchmark, and there is apparently quite a bit of headroom for additional improvements.

Interestingly, its effect on memory usage has been small. I was hoping that the early filtering of many short-lived objects would make the tenured heap grow more slowly and thus reduce memory usage, but the addition of other structures (such as the nursery and store buffers) appears to have balanced that out.

The changes to the graphs at AWSY have been all within the noise, with the exception of the “Fresh start” and “Fresh start [+30s]” measurements in the “explicit” graph, both of which ticked up slightly. This isn’t cause for concern, however, because the corresponding “resident” graph hasn’t increased accordingly, and “resident” is the real metric of interest.

“Compacting Generational GC” is the #1 item on the current MemShrink “Big Ticket Items” list. Hopefully the “compacting” part of that, which still remains to be done, will produce some sizeable memory wins.